Cryptocurrency trading can be a complex endeavor, requiring traders to analyze various indicators to make informed decisions. One such indicator that has gained popularity among crypto traders is the Ichimoku Cloud Indicator. In this article, we will explore what the Ichimoku Cloud Indicator is, how it works, and how it can be effectively used in crypto trading.
What is the Ichimoku Cloud Indicator?
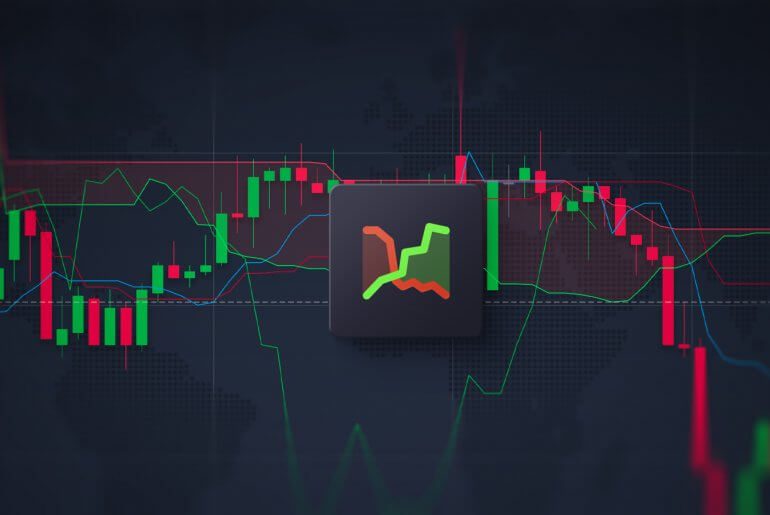
The Ichimoku Cloud Indicator, also known as Ichimoku Kinko Hyo, is a versatile technical analysis tool developed by Japanese journalist Goichi Hosoda in the late 1960s. It provides traders with a comprehensive overview of an asset’s price action, helping them identify trends, support and resistance levels, and potential trading signals.
Components of the Ichimoku Cloud Indicator
The Ichimoku Cloud Indicator consists of several components that work together to provide valuable insights into market trends and potential trading opportunities. Each component serves a specific purpose in analyzing an asset’s price action. Let’s explore the key components of the Ichimoku Cloud Indicator:
- Tenkan-sen (Conversion Line): The Tenkan-sen is a short-term moving average calculated by summing the highest high and lowest low over the past nine periods and then dividing the result by two. It represents the short-term trend of an asset. When the Tenkan-sen rises above the Kijun-sen, it suggests a bullish signal, indicating potential buying opportunities. Conversely, when the Tenkan-sen falls below the Kijun-sen, it indicates a bearish signal, suggesting potential selling opportunities.
- Kijun-sen (Base Line): The Kijun-sen is a longer-term moving average calculated by summing the highest high and lowest low over the past 26 periods and then dividing the result by two. It indicates the overall trend and can act as a support or resistance level. When the price is above the Kijun-sen, it indicates a bullish sentiment, while a price below the Kijun-sen suggests a bearish sentiment.
- Senkou Span A (Leading Span A): Senkou Span A is the average of the Tenkan-sen and Kijun-sen plotted 26 periods ahead. It forms the first boundary of the Ichimoku Cloud, also known as the Kumo. The area between Senkou Span A and Senkou Span B represents future support or resistance levels. When Senkou Span A is above Senkou Span B, it indicates a bullish market sentiment, while the opposite suggests a bearish market sentiment.
- Senkou Span B (Leading Span B): Senkou Span B is calculated in a similar manner to Senkou Span A but uses a longer period. It is plotted 52 periods ahead and forms the second boundary of the Ichimoku Cloud. Like Senkou Span A, it helps identify potential support or resistance levels. When Senkou Span B is above Senkou Span A, it strengthens the bullish market sentiment, and when it is below Senkou Span A, it reinforces the bearish market sentiment.
- Chikou Span (Lagging Span): The Chikou Span represents the current closing price plotted 26 periods behind. It helps traders identify potential reversals or confirm signals provided by other components. When the Chikou Span crosses above the price, it can signal a bullish trend reversal or buying opportunity. Conversely, a crossover below the price suggests a bearish trend reversal or potential selling opportunity.
How Does the Ichimoku Cloud Indicator Work?

The Ichimoku Cloud Indicator consists of several components that work together to provide valuable insights into market trends and potential trading opportunities. These components include:
- Tenkan-sen (Conversion Line): The Tenkan-sen is a short-term moving average calculated by summing the highest high and lowest low over the past nine periods and then dividing the result by two. It represents the short-term trend of an asset.
- Kijun-sen (Base Line): The Kijun-sen is a longer-term moving average calculated by summing the highest high and lowest low over the past 26 periods and then dividing the result by two. It indicates the overall trend and can act as a support or resistance level.
- Senkou Span A (Leading Span A): Senkou Span A is the average of the Tenkan-sen and Kijun-sen plotted 26 periods ahead. It forms the first boundary of the Ichimoku Cloud, also known as the Kumo. It helps identify potential support or resistance levels.
- Senkou Span B (Leading Span B): Senkou Span B is calculated in a similar manner to Senkou Span A but uses a longer period. It is plotted 52 periods ahead and forms the second boundary of the Ichimoku Cloud. The area between Senkou Span A and Senkou Span B represents future support or resistance levels.
- Chikou Span (Lagging Span): The Chikou Span represents the current closing price plotted 26 periods behind. It helps traders identify potential reversals or confirm signals provided by other components.
How to Use the Ichimoku Cloud Indicator in Crypto Trading
- Identifying Trends The Ichimoku Cloud Indicator excels at identifying trends. When the price is above the cloud, it indicates an uptrend, while a price below the cloud suggests a downtrend. Traders can look for opportunities to buy or sell based on the direction of the trend.
- Support and Resistance Levels The Senkou Span A and Senkou Span B form the boundaries of the Ichimoku Cloud, which can act as support or resistance levels. Traders can use these levels to determine entry and exit points or set stop-loss orders.
- Trading Signals Crossovers between the Tenkan-sen and Kijun-sen, as well as the Chikou Span crossing the price, can generate trading signals. A bullish crossover indicates a potential buying opportunity, while a bearish crossover suggests a possible selling opportunity.
Pros and Cons of the Ichimoku Cloud Indicator
The Ichimoku Cloud Indicator offers several advantages and disadvantages for crypto traders. Understanding these pros and cons can help traders make informed decisions about whether to incorporate this indicator into their trading strategy.
Pros:
- Comprehensive Analysis: The Ichimoku Cloud Indicator provides a holistic view of an asset’s price action. It combines multiple components and factors, offering a more comprehensive analysis compared to single-indicator approaches.
- Trend Identification: One of the key strengths of the Ichimoku Cloud Indicator is its ability to identify trends. By analyzing the position of the price in relation to the cloud, traders can quickly determine whether an asset is in an uptrend or a downtrend.
- Support and Resistance Levels: The Ichimoku Cloud Indicator helps identify potential support and resistance levels. The Senkou Span A and Senkou Span B, which form the boundaries of the cloud, act as dynamic support and resistance levels that can guide trading decisions.
- Trading Signals: The indicator generates trading signals through crossovers and interactions between its components. For example, a bullish crossover between the Tenkan-sen and Kijun-sen may indicate a buying opportunity, while a bearish crossover could suggest a selling opportunity.
- Versatility: The Ichimoku Cloud Indicator can be applied to various timeframes and asset classes, including cryptocurrencies. Its adaptability makes it a valuable tool for both short-term and long-term traders.
Cons:
- Complexity: The Ichimoku Cloud Indicator has a relatively steep learning curve. Its multiple components and their interactions require traders to invest time and effort in understanding and interpreting the indicator accurately.
- False Signals: Like any technical indicator, the Ichimoku Cloud Indicator is not flawless and can generate false signals, especially in choppy or sideways markets. Traders need to exercise caution and consider additional analysis before basing trading decisions solely on the indicator’s signals.
- Lagging Nature: Some traders find the Ichimoku Cloud Indicator to be slightly lagging in nature, as it relies on historical price data. Consequently, it may not provide timely signals for rapid market movements or sudden trend reversals.
- Subjectivity in Interpretation: The interpretation of the Ichimoku Cloud Indicator involves subjective analysis. Traders may have different approaches and interpretations, which can lead to variations in trading strategies and outcomes.
- Requires Confirmation: To mitigate false signals and enhance accuracy, traders often combine the Ichimoku Cloud Indicator with other technical indicators or fundamental analysis. This additional confirmation can add complexity to the overall trading strategy.
Conclusion
The Ichimoku Cloud Indicator is a powerful tool for crypto traders, offering valuable insights into market trends, support and resistance levels, and potential trading signals. By understanding its components and how to interpret them, traders can enhance their decision-making process and improve their trading outcomes.
FAQs
How do I interpret the Ichimoku Cloud Indicator in crypto trading?
The Ichimoku Cloud Indicator can be interpreted by considering the position of the price relative to the cloud, crossovers between the Tenkan-sen and Kijun-sen, and the Chikou Span’s interaction with the price.
Can the Ichimoku Cloud Indicator be used for short-term trading?
Yes, the Ichimoku Cloud Indicator can be applied to short-term trading strategies by adjusting the time periods used for calculation.
Are there any alternative indicators to the Ichimoku Cloud Indicator?
Yes, there are alternative indicators like moving averages, Bollinger Bands, and Relative Strength Index (RSI) that traders can use in combination with or as an alternative to the Ichimoku Cloud Indicator.
Does the Ichimoku Cloud Indicator guarantee profitable trades?
No indicator can guarantee profitable trades. The Ichimoku Cloud Indicator is a tool that provides insights and signals, but it should be used in conjunction with other analysis techniques and risk management strategies.
How can I learn more about the Ichimoku Cloud Indicator?
There are various online resources, books, and video tutorials available that provide in-depth explanations and examples of using the Ichimoku Cloud Indicator in crypto trading.


